
Historical frequency: how to read counts without making predictions
Is there a number that is more “hot” because it often appears on the short list? We notice a pattern in the past rows, but the frequency count is not an automatic prediction. Before interpreting, fix the denominator and the method of sampling.

One count, two stories
| False sample | Appearance of digit 7 | Just what is measured |
|---|---|---|
| 10 ordered-digit records | 4 records | Past count in selected small list. |
| 100 ordered-digit records | 4 records | Different denominator and different frequency. |
| Records selected because there are 7 | 4 out of 4 | Selection bias; not a representative sample. |
Fix the sample before counting
First set the game, date range and session. If records are counted, 7-7-2 is a record with the digit 7. As for digit positions, that’s two occurrences of 7. Do not change a definition in the middle of the spreadsheet. Keep raw rows to see if any are missing or duplicated.
In PCSO archive, select the exact game and season; don’t mix 3D sessions and six-number games in a frequency table.
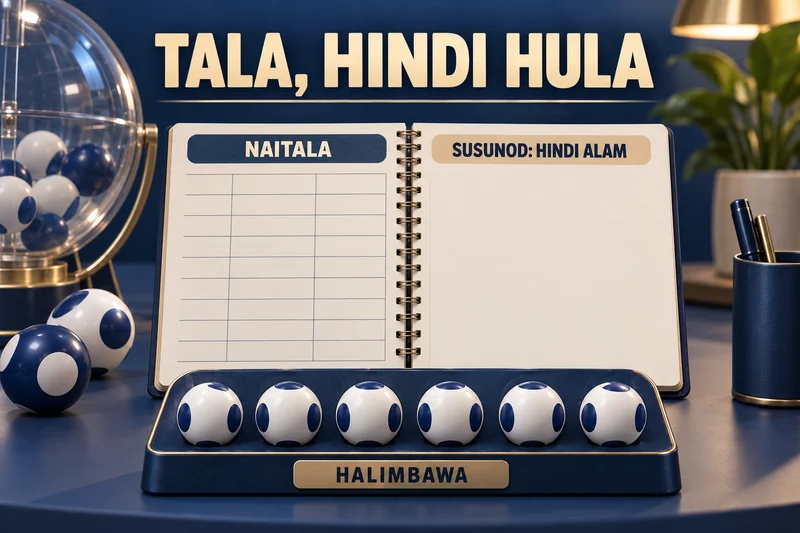
Past proportion is not a new probability
Four out of ten is 40% of the fake sample. It does not prove that the digit has a 40% chance in the next draw. In the independent, uniform model, the new event has a probability determined by the model, not by the small streak. A claim that the actual draw is biased requires appropriate data and analysis; you don’t have an audit here.
How to create an honest caption?
Write “4 out of 10 selected records, game X, period Y, counted once per record.” Avoid calling it a forecast. If you don’t know if the archive selection is complete, add that as a limit. A clear sample is more useful than a colorful hot-number ranking.
Related reading
For other formats, read bingo and lottery hub. Naa library of guides the topics are more detailed; the game ph has a general overview of the site.
Methodology: documentary reading and own example or calculation. Sources checked 6 October 2026; no ticket purchased or draw played for the guide. Hypothetical models are not live results, predictions or claim approvals.
Related reading
Rolling lottery counts: overlapping windows reuse the same draws | game ph