
Rolling lottery counts: overlapping windows reuse the same draws
Two seven-draw frequency tables can share several results. They are not automatically fourteen separate observations. Before combining rolling counts, identify the draws included in each window and check which records appear in both.
This example in the game ph lottery section uses ten invented draws of a fictional two-digit product. The result being counted is exactly 07, once per draw. The table is not a real archive, a recommendation or an estimate of the next draw’s chance.
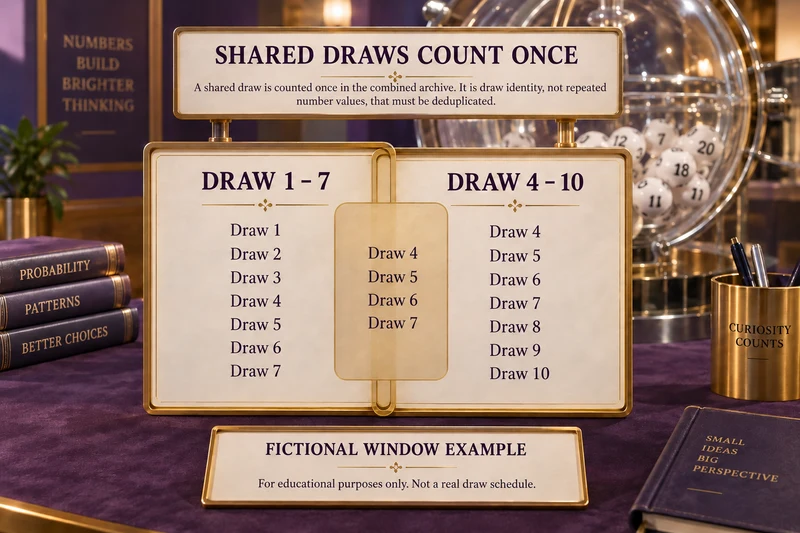
Two windows, ten distinct draws
Window A covers draws 1 through 7. Window B covers draws 4 through 10. Each contains seven records, but draws 4, 5, 6 and 7 are in both. Their union contains ten distinct draws, not fourteen.
| Fictional draw | Result | In window A? | In window B? |
|---|---|---|---|
| 1 | 12 | Yes | No |
| 2 | 07 | Yes | No |
| 3 | 24 | Yes | No |
| 4 | 36 | Yes | Yes |
| 5 | 07 | Yes | Yes |
| 6 | 18 | Yes | Yes |
| 7 | 42 | Yes | Yes |
| 8 | 23 | No | Yes |
| 9 | 07 | No | Yes |
| 10 | 51 | No | Yes |
Window A contains two results of 07, at draws 2 and 5. Window B also contains two, at draws 5 and 9. Both proportions are 2/7, about 28.57%. The shared result at draw 5 contributes to both windows.
Decide what the combined number is meant to describe
Adding the two window counts gives four counted occurrences across fourteen window positions. That arithmetic describes the two lists with their overlap retained. It cannot be labelled “four appearances in fourteen distinct draws,” because there are only ten distinct draws in the underlying example.
To summarize the combined distinct archive, count each draw once. The three occurrences are at draws 2, 5 and 9, so the distinct-archive proportion is 3/10, or 30%. The difference is caused by reusing records, not by an extra draw or a changed result.
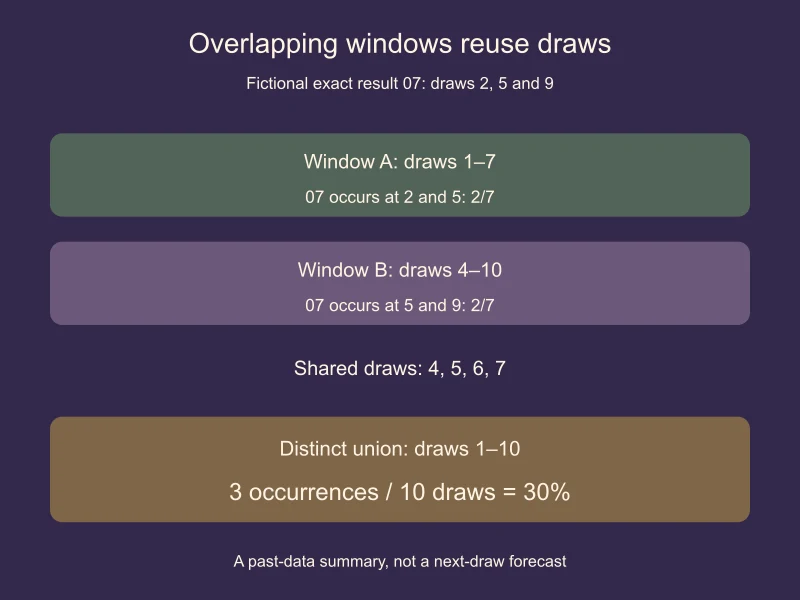
Averaging the two 2/7 proportions also gives 2/7. It does not remove the repeated draw identities. Equal window lengths make that average easy to calculate, but they do not turn overlapping windows into disjoint samples.
A moving window deliberately retains older observations
NIST’s moving-average explanation shows a window advancing through successive observations while dropping the oldest. That is a way to summarize a recent portion of past data. It is not evidence that every displayed window contains a completely new set of observations.
For a lottery frequency chart, be explicit about whether the window counts draws, calendar days or sessions. Seven days may contain a different number of draws when a product has several daily sessions or missing records. This example uses one record per numbered draw, so its denominators are known.
A change in the chart does not always mean a new appearance
Consider the step from draws 1–7 to draws 2–8. The first window loses draw 1, a result of 12, and gains draw 8, a result of 23. The count of 07 stays at two. Next, moving to draws 3–9 loses draw 2, a result of 07, and gains draw 9, also 07. The count again stays at two, even though a new 07 appeared.
A flat line therefore does not prove that nothing happened. It can reflect one occurrence leaving while another enters. Read the endpoints and underlying records before interpreting a rise, fall or unchanged rolling total.
Keep the record identity and counting definition
Build the summary from a single verified set of draw records. For this invented product, the key is the product plus draw number. A real archive may require the date, session and timezone as well. If a record is corrected, preserve its identity and correction history rather than count the earlier and revised values as two draws.
State that the event is the exact result 07. Counting any result containing the digit 7 would be a different event, and counting digit positions would be another. The guide to reading historical frequency without treating it as a prediction explains those denominator and event-definition choices.
Label the chart so another reader can reproduce it
A clear label is: “Exact result 07; fictional draws 4–10; two occurrences in seven records; overlaps draws 4–7 with the previous example window.” For the union, use “three occurrences in ten distinct draws.” Keep those two descriptions separate because they answer different questions.
The example provides no predictive advantage and does not audit the fairness of an actual lottery. Source and window arithmetic checked on 10 October 2026. The useful outcome is a count whose numerator, denominator and reused records are visible.